The inference engine behind my personal AI assistant (gufo, on the Strix Halo box from
the first post) does one thing perfectly and
one thing absent: it serves tokens, and it has no web UI. The entire
observability story out of the box is a /metrics endpoint that dumps a few
hundred lines of Prometheus plaintext:
$ curl -s http://inference-box:8080/metrics | head
# HELP llama_cpp:num_requests Number of processed requests
# TYPE llama_cpp:num_requests counter
llama_cpp:num_requests 23092
# HELP llama_cpp:seconds_per_token_generated ...
Which is great — if you are a Prometheus with a Grafana habit and a weekend to spare. I am a person with a second-hand dashboard reflex who wants to glance at one page while my assistant is mid-sentence. So: build the page.
The constraints
Before any code, the rules I gave myself:
- Read-only. The monitor must never be able to touch the engine beyond
scraping
/metrics. A monitoring page that can restart things is an outage waiting for a curious guest. - LAN only. It watches a machine that already has zero inbound ports from the internet. The monitor does not change that.
- Zero external assets. No CDN fonts, no analytics, no chart library phoning home. One service, one HTML page, whatever the engine can already draw.
- Explain itself. Every tile should answer "is this number normal?" without a wiki.
The architecture, which barely deserves the word: a small companion service
polls the engine's /metrics every second, computes deltas and rates, and
pushes the snapshot to the browser. Engine dies → the page goes stale within
seconds, which is exactly the alert I want visible from across the room.
The page
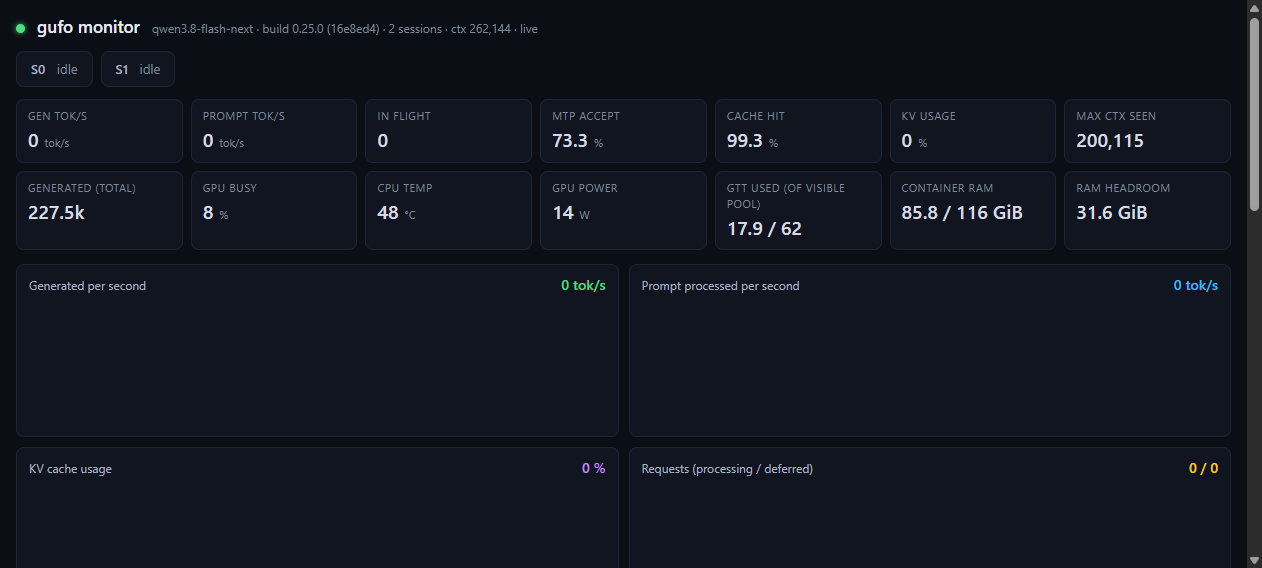
Top to bottom:
- Header strip — model, engine build, session count, context size, and a green dot that means "scrape succeeded in the last few seconds." When the dot goes grey, the dot is the whole post-mortem.
- Session chips — one per slot (
-j 2means two). Idle vs processing. This is the fastest "why is my assistant slow?" check in existence: if both chips are busy, nothing else on this page matters yet. - Stat tiles — throughput, cache, and hardware numbers. I will take the interesting ones below.
- Charts — the last few minutes of each series. Flatlines are information too.
- Recent requests table — the real hero. More on it below.
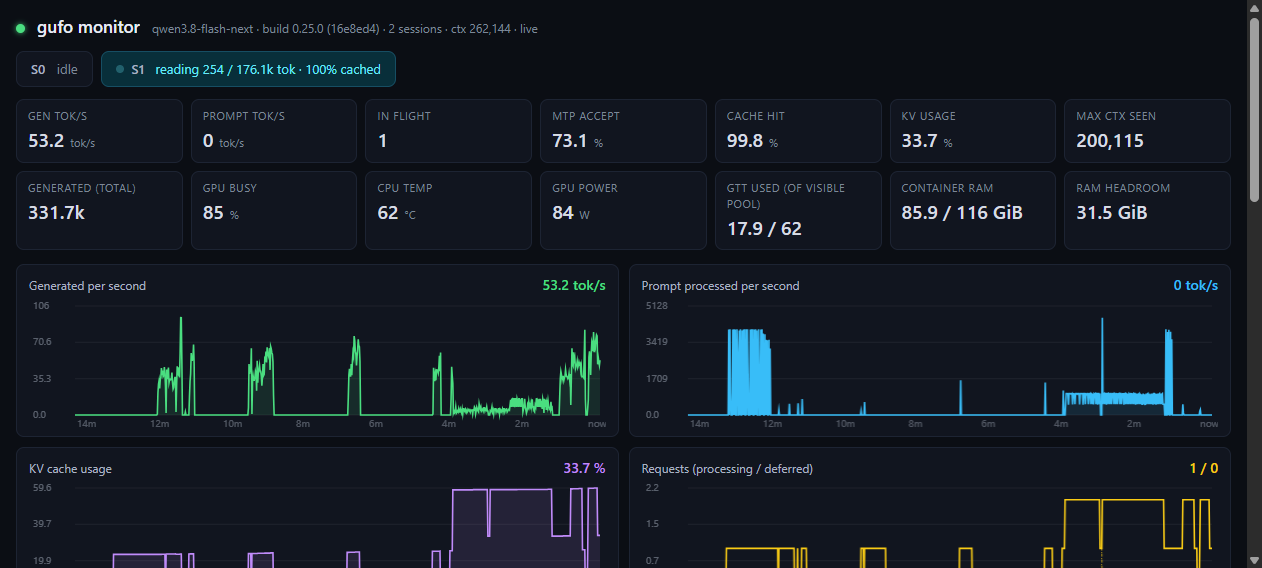
The same page under real load, minutes later — 53 tok/s of decode, the S1 chip mid-read on a 176k-token session at 100 % cache, GPU at 85 %, and the charts finally earning their pixels:
The five numbers I actually watch
1. Prefix cache hit. The engine keeps KV cache from previous turns; a long-running conversation re-sends a long system prompt plus history on every turn, so this number should sit near 99 %. On the box today: 98.8–99.3 %. If it drops, the cache is being evicted — usually because context is growing toward the limit.
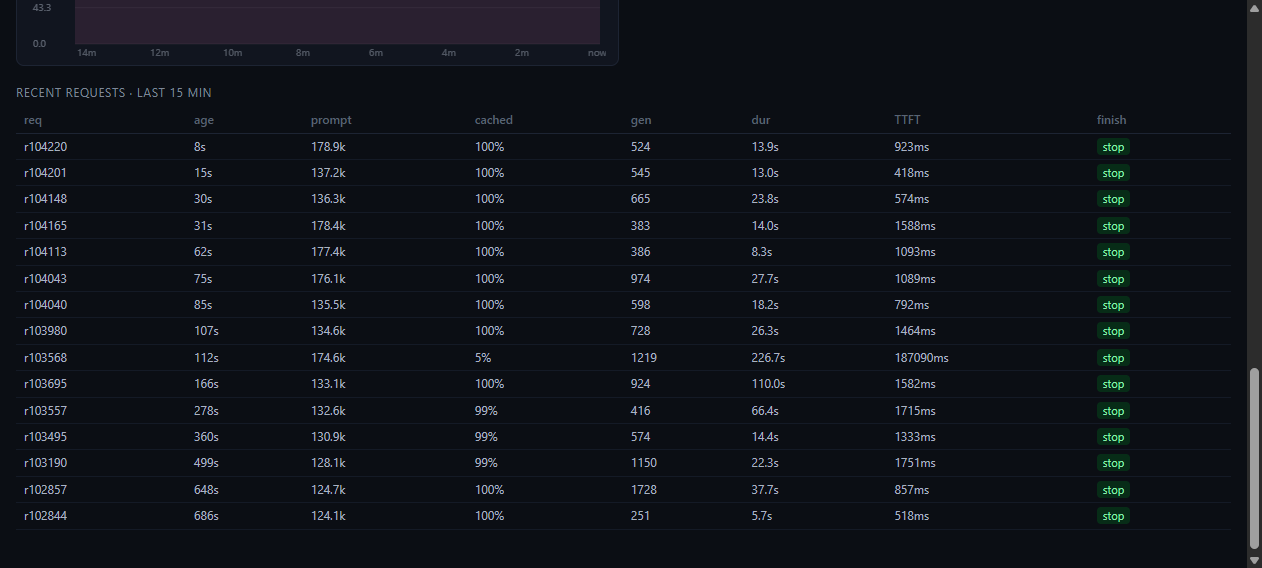
2. TTFT, warm vs cold. Time to first token is the number you actually feel. Warm rows land in 500–1200 ms. Here is the gift the table gives you — two rows, same morning:
| req | prompt | cached | TTFT | dur |
|---|---|---|---|---|
| r23092 | 61.3k tok | 100 % | 720 ms | 23.2 s |
| r22937 | 60.9k tok | 15 % | 33.7 s | 38.3 s |
Same size prompt. The cached one answered in under a second; the cold one prefilled ~52k uncached tokens at roughly 1.5k tok/s and the user waited half a minute. Everything about tuning conversational inference falls out of this one comparison.
And the table catches both regimes as they happen — a 5 %-cached 174k-token prompt paying 187 s of TTFT, sitting between a field of 100 %-cached rows:
3. MTP accept rate. The model runs multi-token prediction — draft tokens that get verified in bulk. The monitor tracks what fraction the verifier accepts: 65–75 % here. Below ~50 % the speculative machinery is mostly wasting compute and it is worth knowing why (odd traffic, different workload than the draft was good at).
4. KV usage & max ctx seen. Context is a budget: 262,144 tokens total,
and max ctx seen says the biggest live session touched 200,115 — 76 %
of the budget. That is the eviction alarm before the eviction.
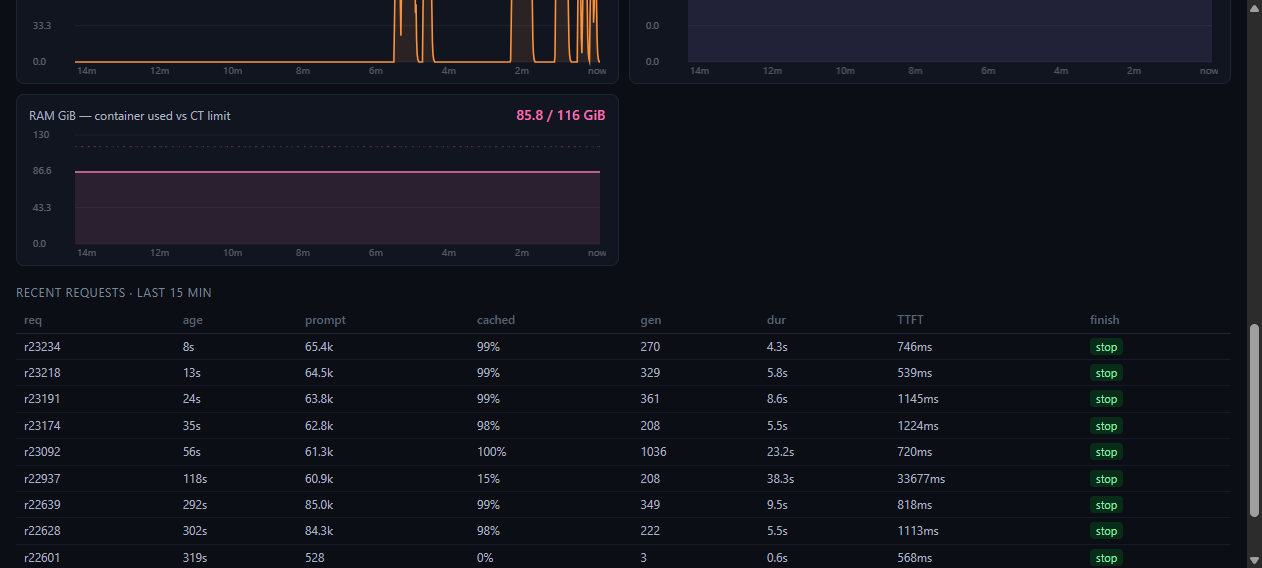
5. RAM headroom. Unified memory means the model, the KV cache, and the rest of the container all fight in one pool. 85.8 / 116 GiB used, 31.6 GiB headroom. Headroom shrinking over days = a leak; shrinking in minutes = the next big conversation.
What it caught (that /metrics never showed me)
- A retry storm from a misconfigured gateway: the requests chart shows a comb of 3-token requests every ~60 s. Ten seconds of looking at the table beat an hour of grepping logs.
- One conversation that grew to 200k tokens and never got pruned — visible
as
max ctx seenratcheting up whilecache hitslid down. - Idle draw of ~15–30 W with CPU at 48 °C, so "is it even running?" is now a glance instead of an SSH session.
Next
- Per-session token accounting (which client is eating the cache).
- A 24 h view; the current window is minutes.
- An optional webhook alert on stale scrape, so the green dot can also yell.
Total build cost: less than a Grafana install, and it already pays rent. From zero to hero, as promised — the hero part is that I stopped guessing.